Pandemic Dilemmas: Human perception of exponentially increasing data displayed on a log scale evaluated through experimental graphics tasks
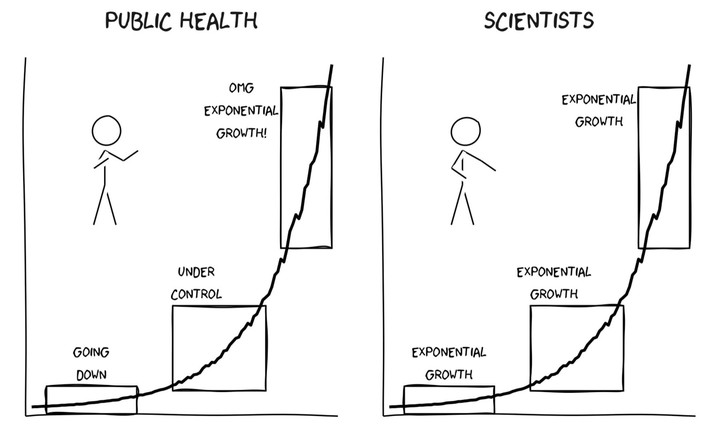 Image credit: xkcd
Abstract
View live session slides here.
Log scales are often used to display data over several orders of magnitude within one graph. During the COVID-19 pandemic, we have seen both the benefits and the pitfalls of using log scales to display case counts. Graphical experimental tasks were conducted to evaluate the impact our choice of scale has on human perception of exponentially increasing trends. Lineups and visual inference were used to evaluate whether our ability to perceptually notice differences in exponentially increasing trends is impacted by the choice of scale. Our other experimental tasks focus on determining whether there are cognitive disadvantages to log scales by testing an individual’s ability to use and make predictions for exponentially increasing data. We asked participants to draw a line using their computer mouse through the increasing exponential trend shown on both scales and to translate a graph of exponentially increasing data into real value quantities. The results of our experimental tasks allow us to provide guidelines for readers to actively choose which of many possible graphics to draw, according to some set of design choices, to ensure that our charts are effective.