Pandemic Dilemmas: Human perception of exponentially increasing data displayed on a log scale evaluated through experimental graphics tasks
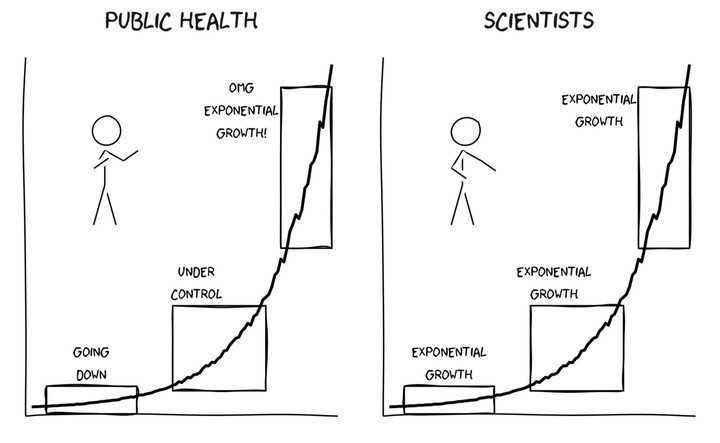 Image credit: xkcd
Abstract
View live speed session slides here.
Log scales are often used to display data over several orders of magnitude within one graph. Three graphical experimental tasks were conducted to evaluate the impact displaying data on the log scale has on human perception of exponentially increasing trends compared to displaying data on the linear scale. The first experiment evaluates whether our ability to perceptually notice differences in exponentially increasing trends is impacted by the choice of scale. Participants were shown a set of plots and asked to identify which plot appeared to differ most from the other plots. Results indicated that when there was a large difference in exponential curves, the choice of scale had no impact and participants accurately differentiated between the two curves on both the linear and log scale. However, displaying exponentially increasing data on a log scale improved the accuracy of differentiating between exponentially increasing curves with slight differences. An exception occurred when identifying an exponential curve from curves closely resembling a linear trend, indicating it is easy to identify a curve in a group of lines but much harder to identify a line in a group of curves. The other experimental tasks focus on determining whether there are cognitive disadvantages to log scales - do log scales make it harder to make use of graphical information? To test an individual’s ability to make predictions for exponentially increasing data, participants were asked to draw a line using their computer mouse through an exponentially increasing trend shown on both the linear and log scale. Results showed that when exponential growth rate is large, underestimation of exponential growth occurs when making predictions on a linear scale and there is an improvement in accuracy of predictions made on the log scale. The last experimental task is designed to test an individuals’ ability to translate a graph of exponentially increasing data into real value quantities and make comparisons of estimates. The results of the three experimental tasks provide guidelines for readers to actively choose which of many possible graphics to draw in order to ensure their charts are effective at communicating the intended result.