Emily A. Robinson

Emily A. Robinson

Assistant Professor of Statistics

California Polytechnic State University - San Luis Obispo

About me

Hi there πŸ‘‹ I’m Emily!

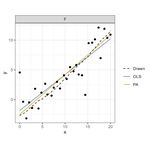
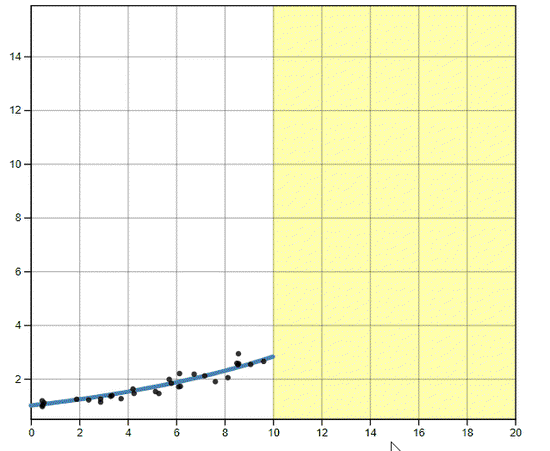
I am an Assistant Professor of Statistics at Cal Poly located on the central coast in San Luis Obispo, CA. My current research, in collaboration with Dr. Susan VanderPlas and Dr. Reka Howard, focuses on the use of graphical tests to evaluate data visualization design choices in order to effectively communicate the intended result. I am currently learning how to create interactive visualizations using D3.js. I am passionate about teaching, mentoring, and collaboration.

Outside of work, I enjoy outdoor recreation πŸƒ 🚴 🎿, gardening 🌻 🌿 , and reading πŸ“š (check out Reese’s Book Club Picks)!

πŸ˜„ Pronouns: she/her

Interests

  • Data Visualization
  • Experimental Design
  • Statistical Consulting
  • Statistics Education

Education

  • Ph.D. in Statistics, 2019 - 2022

    University of Nebraska - Lincoln

  • M.S. in Statistics, 2017 - 2019

    University of Nebraska - Lincoln

  • B.S. in Statistics and Secondary Mathematics Education, 2013 - 2017

    Winona State University

Recent & Upcoming Talks

Eye Fitting Straight Lines in the Modern Era

How do statistical regression results compare to intuitive, visually fitted results?

Human perception of exponentially increasing data displayed on a log scale evaluated through experimental graphics tasks

We conducted a series of three graphical studies to evaluate the impact displaying data on the log scale has on human perception of exponentially increasing trends compared to displaying data on the linear scale.

Projects

*

You Draw It

Method for graphical testing adapted from the NYTimes You Draw It feature.

UNL Thesisdown Template

Writing your UNL thesis with bookdown.

Perception of Log Scales

Ph.D. work in graphical testing and perception of exponentially increasing trends.

Experience


Assistant Professor of Statistics

California Polytechnic State University

Sep 2022 – Present San Luis Obispo, CA
Courses taught

  • STAT 218: Applied Statistics for Life Sciences, 4 credit hours (F2022)


Statistical Consultant

Statistical Cross-disciplinary Collaboration & Consulting Lab (SC3L)

Jan 2019 – May 2022 University of Nebraska - Lincoln

75+ clients, 100+ projects, 12 publications

Work one-on-one with clients to design experiments, conduct power analyses, summarize data, and conduct statistical analyses, interpret results, provide written research reports. Collaborate on graduate theses and manuscripts for peer reviewed journal publication.

STAT 825: Principles of Statistical Consulting, 3 credit hours

  • SC3L Assistant (Fall 2019, Fall 2020, Fall 2021)
  • Assist in leading hands-on activities such as role playing, report writing, and creating data visualizations in the introductory consulting course once a week. Invite students to shadow client meetings and mentor students in leading their own client meetings.

STAT 930, Advanced Consulting, 2 credit hours

  • SC3L Assistant (Spring 2020, Spring 2021)
  • Mentor students on leading meetings, running analysis, and writing reports.


Graduate Teaching, Instructor of Record

University of Nebraska - Lincoln

Aug 2017 – May 2019 Nebraska

Average instructor rating: 3.75/4.

STAT 218: Introduction to Statistics, 3 credit hours

  • Instructor of Record (Spring 2018, Fall 2018), Co-Instructor (Fall 2017)
  • Simulation based introductory statistics course.
  • Text used: “Introduction to Statistical Investigations,” by Tintle et al.
  • Created and led lectures, wrote exams and homework assignments, assigned grades, held office hours.

STAT 380: Statistics & Applications, 3 credit hours

  • Instructor of Record (Spring 2019)
  • Calculus based introductory statistics course.
  • Text used: ”Probability and Statistics for Engineers and Scientists,” 9th Edition by Walpole et al.
  • Created and led lectures, wrote exams and homework assignments, assigned grades, held office hours.


Berkley Human Services

Actuarial Intern

May 2017 – Aug 2017 Minneapolis, Minnesota
Gathered and managed data on non-profit organizations. Identified common attributes between non-profits insured by the company using Tree Based Machine Learning methods.


Secondary Mathematics Student Teaching Experience

Rushford-Peterson Senior High School

Jan 2017 – May 2017 Rushford, Minnesota

Courses taught: HS Geometry, College Algebra Prep, Alternative Mathematics

Lead daily class lessons, developed lesson plans, exams, and supplemental materials for learning. Aligned standards and met the 10 Standards of Effective Practice.


Credit Risk Intern

John Deere Financial

May 2016 – Aug 2016 Johnston, Iowa
Developed a portfolio liquidation model using Multinomial Logistic Regression in SAS. Created an excel user interface using macros.


Statistics Intern

John Deere Headquarters

May 2015 – Aug 2015 Moline, Illinois
Created and coded an R-shiny application for sales forecasting validation using the dplyr and ggplot2 packages in R opensource software..

Skills

R Programming

Tidyverse + R markdown + Xaringan

SAS Programming

GLIMMIX/NLMIXED + MCMC/BGLIMM

GitHub

Python

Rookie

JavaScript

Rookie + Learning D3.js

Data Visualization

RShiny + ggplot + plotly

Math & Stats

Generalized Linear Mixed Models + Experimental Design + Supervised/Unsupervised Learning

Consulting & Collaboration

Design Experiments + Power Analyses + Data Analysis + Interpretation

Contact

I would love to connect. Please contact me at: erobin17@calpoly.edu.